
Featured Infographics
Content Graphics designs scalable 2-D vector art and iconography for data visualization.
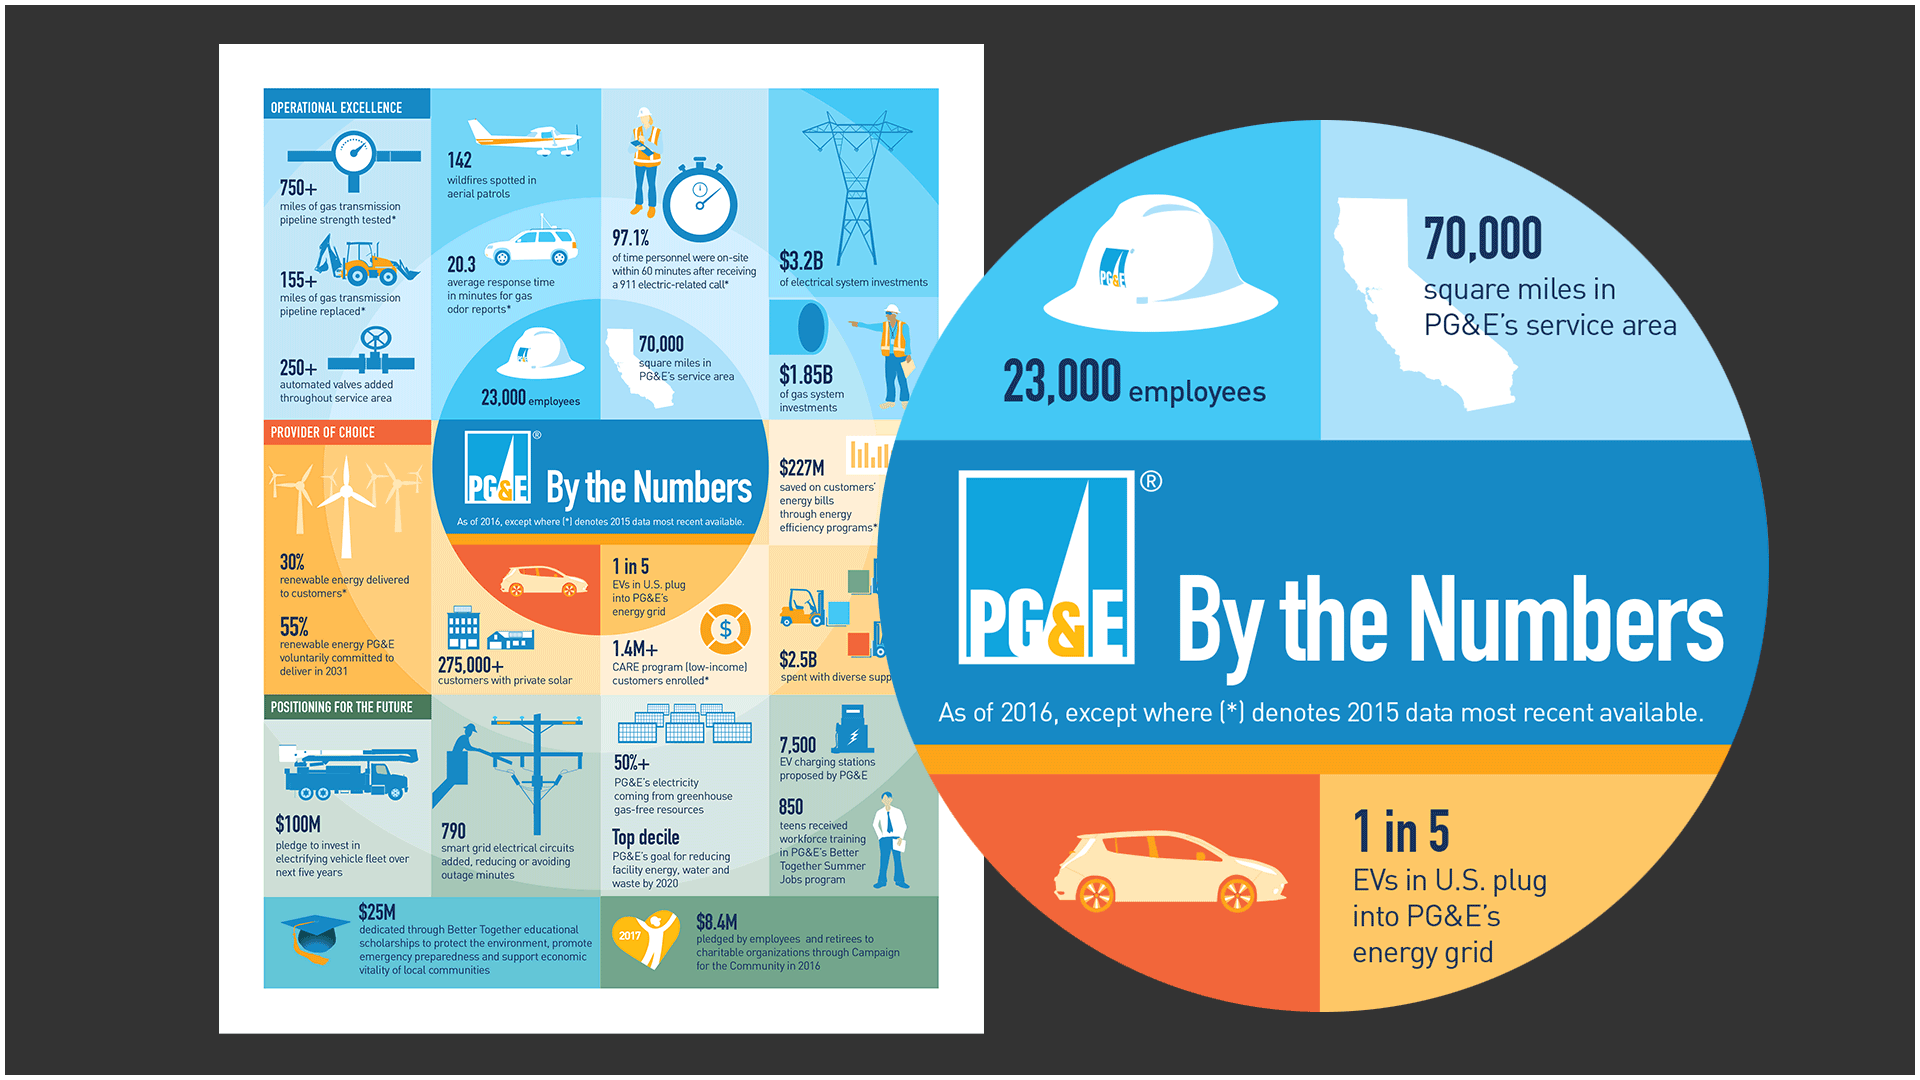 PG&E By the Numbers.
 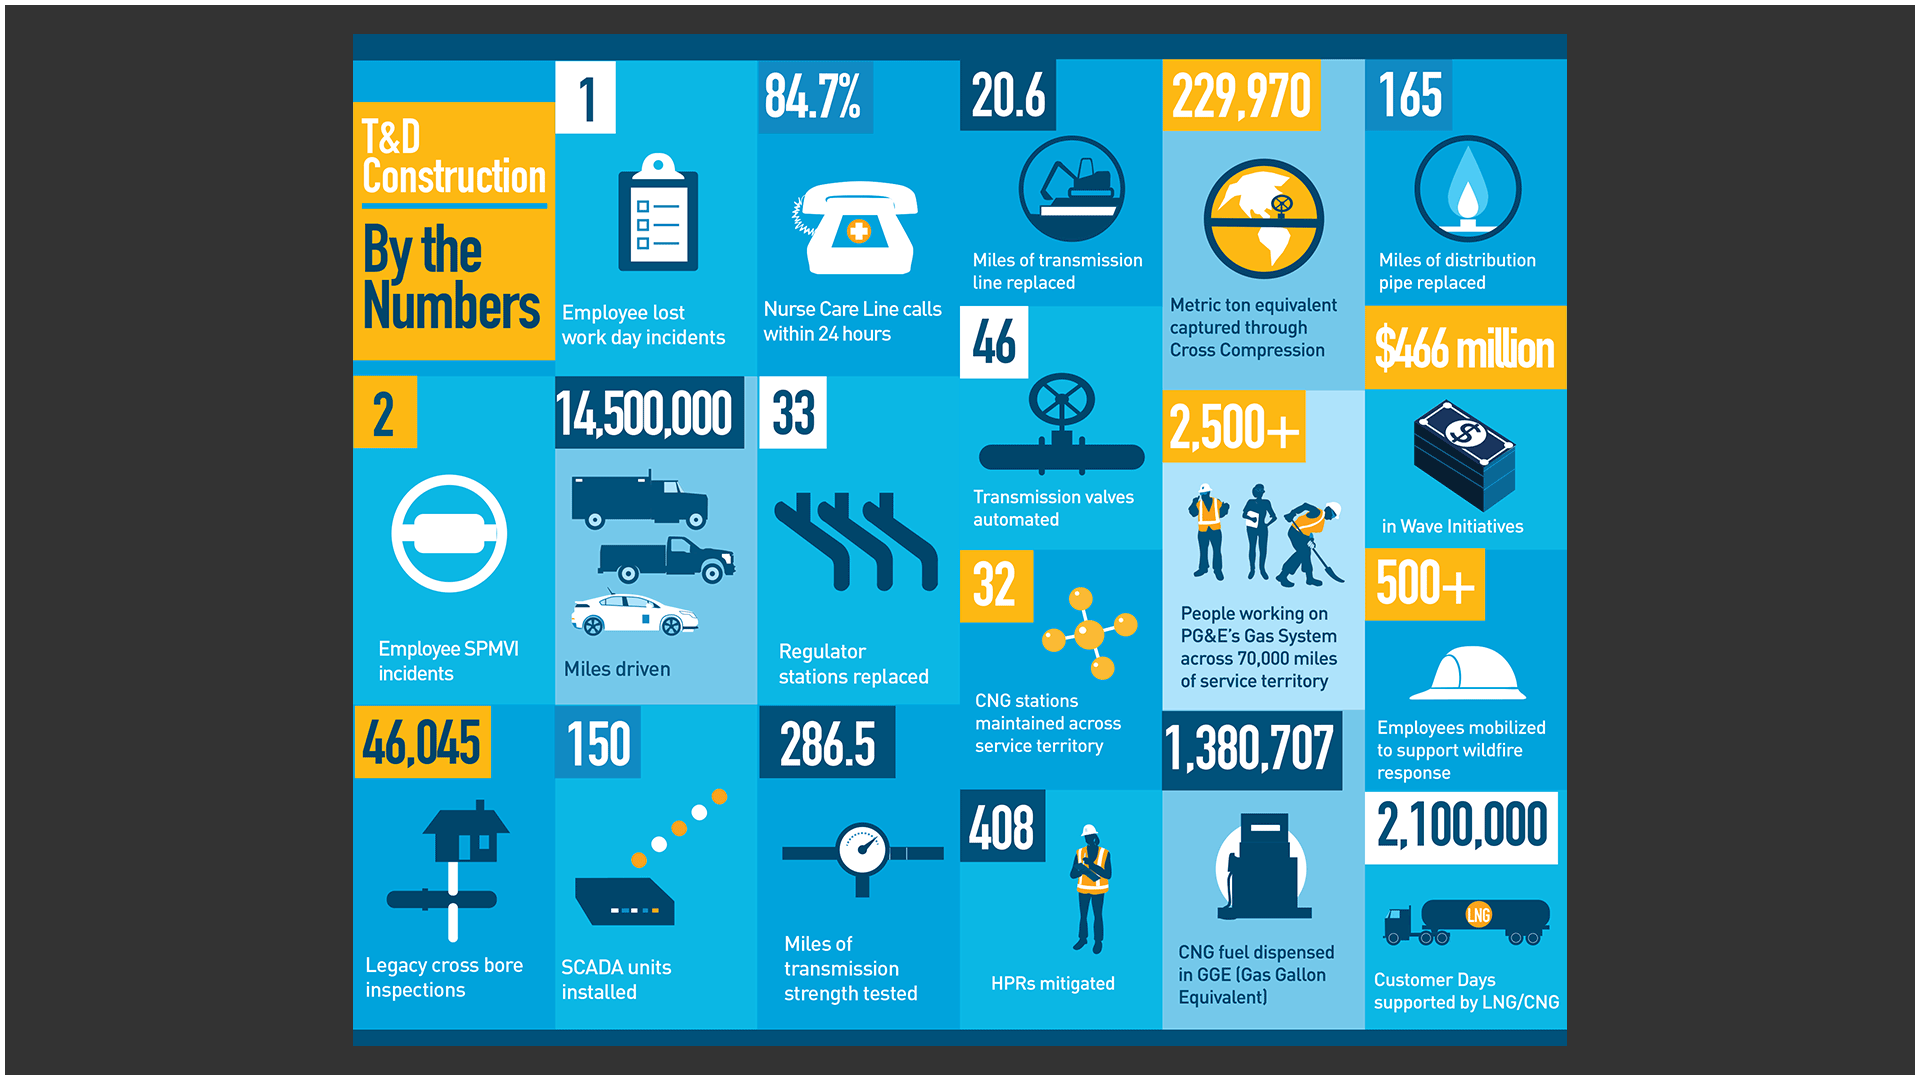 PG&E Gas T&D Construction: By the Numbers.
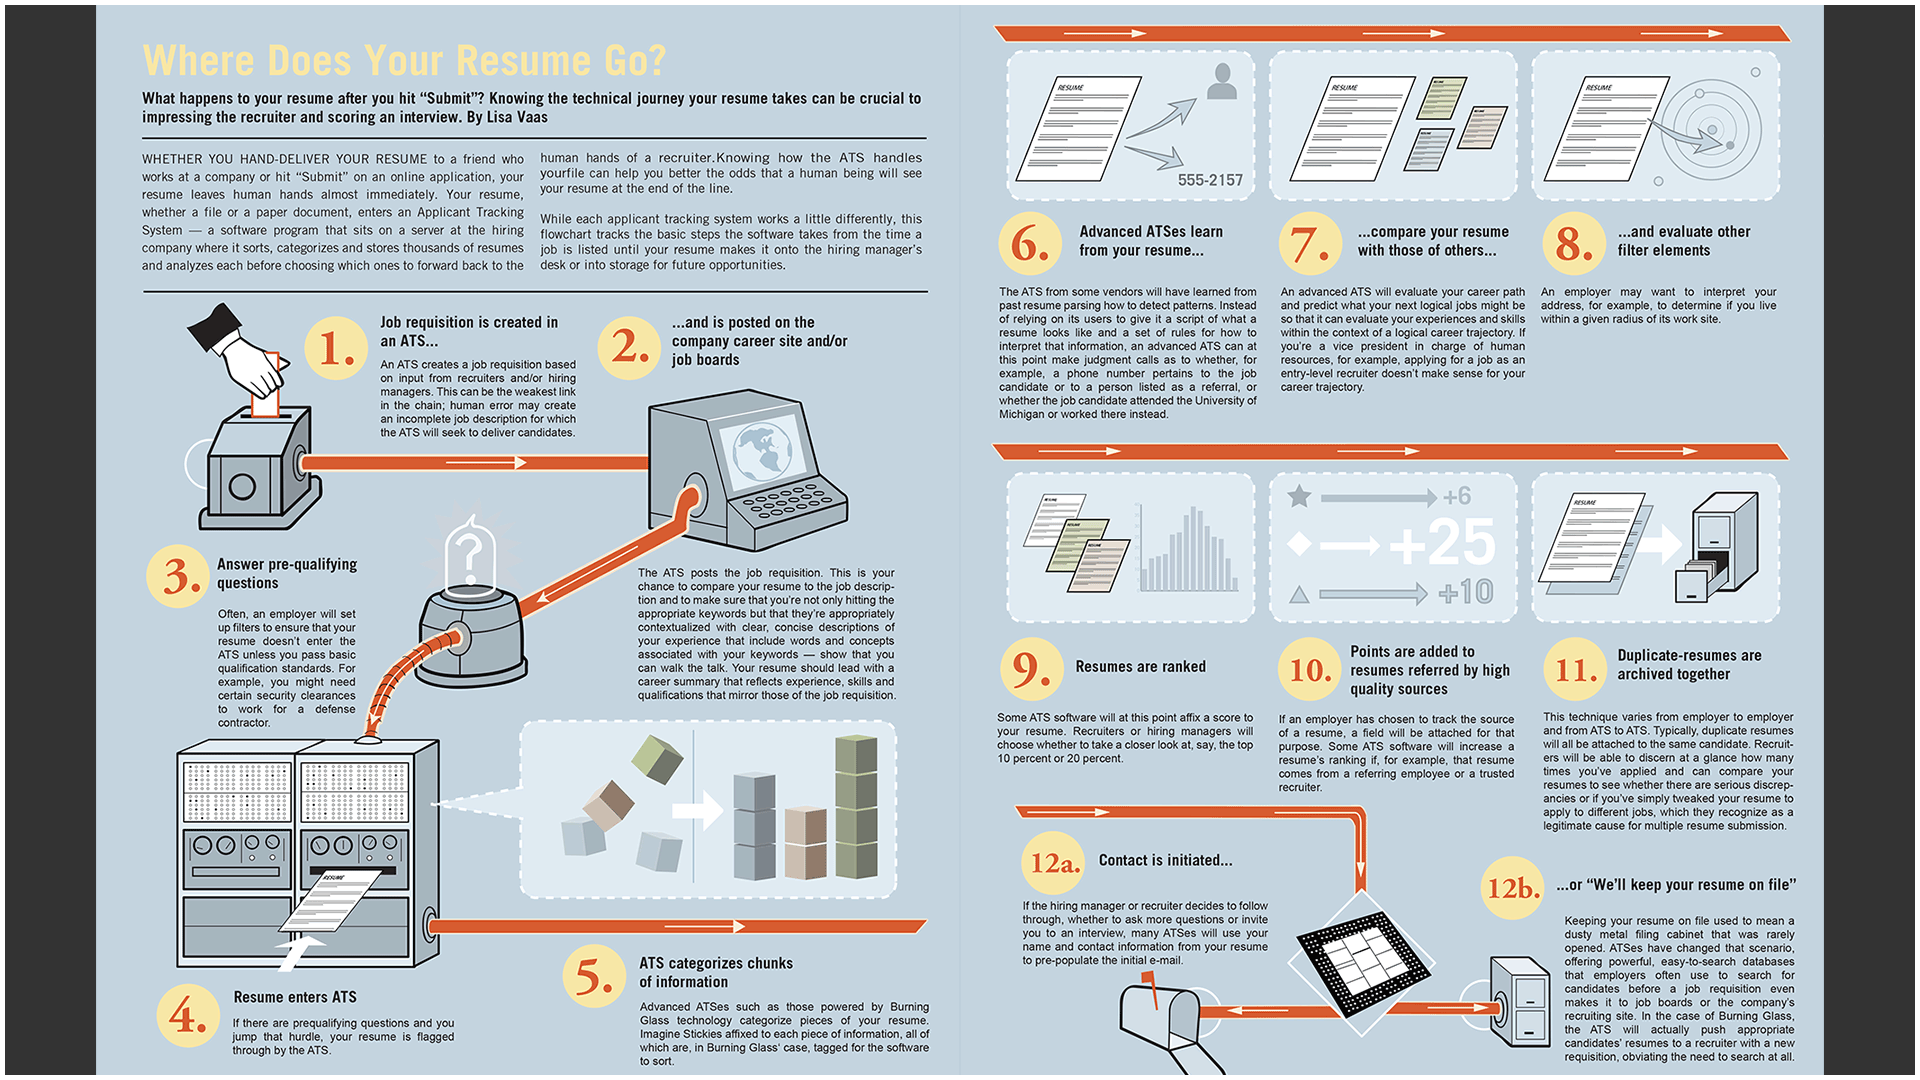 Where Does Your Resume Go? The Ladders newsletter.
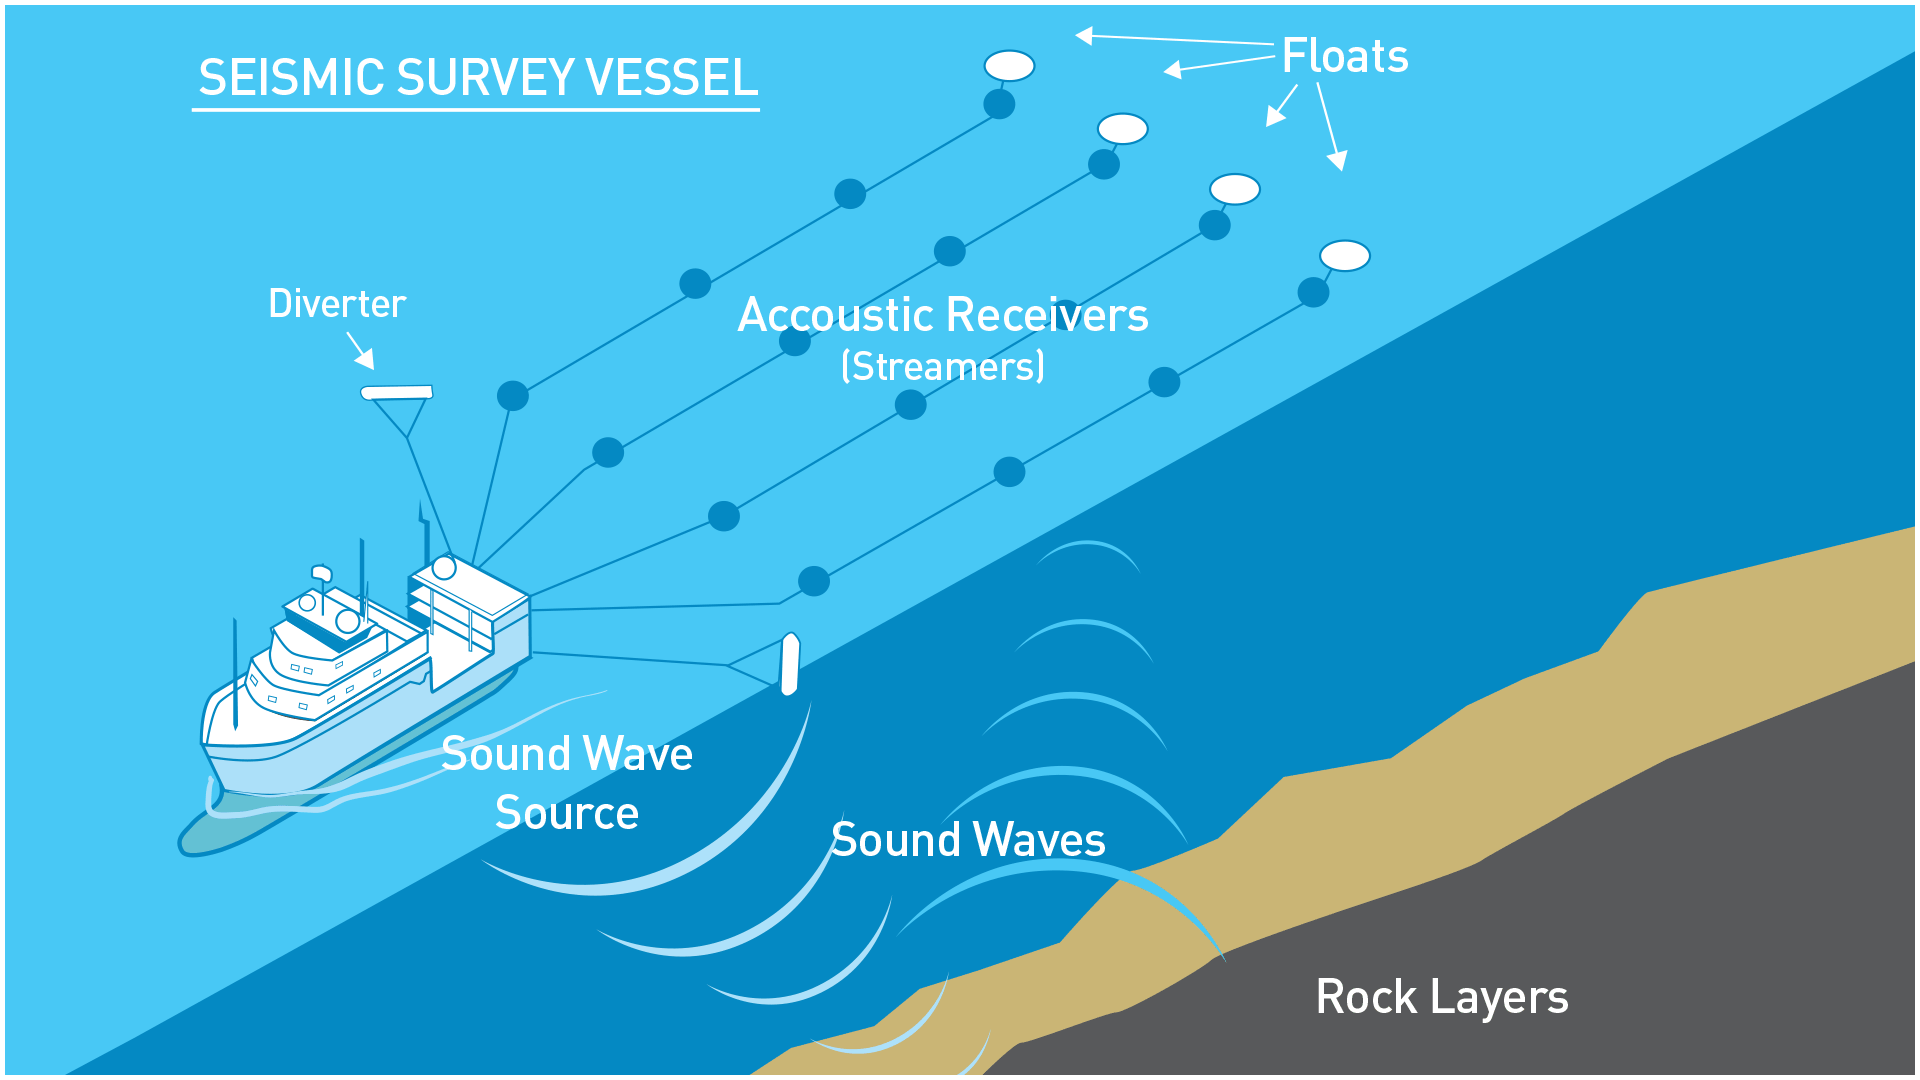 Seismic survey schematic drawing. Vector art created in Adobe Illustrator.
 Technical infographic: Strength Testing Improves PG&E Gas Pipeline Safety.
 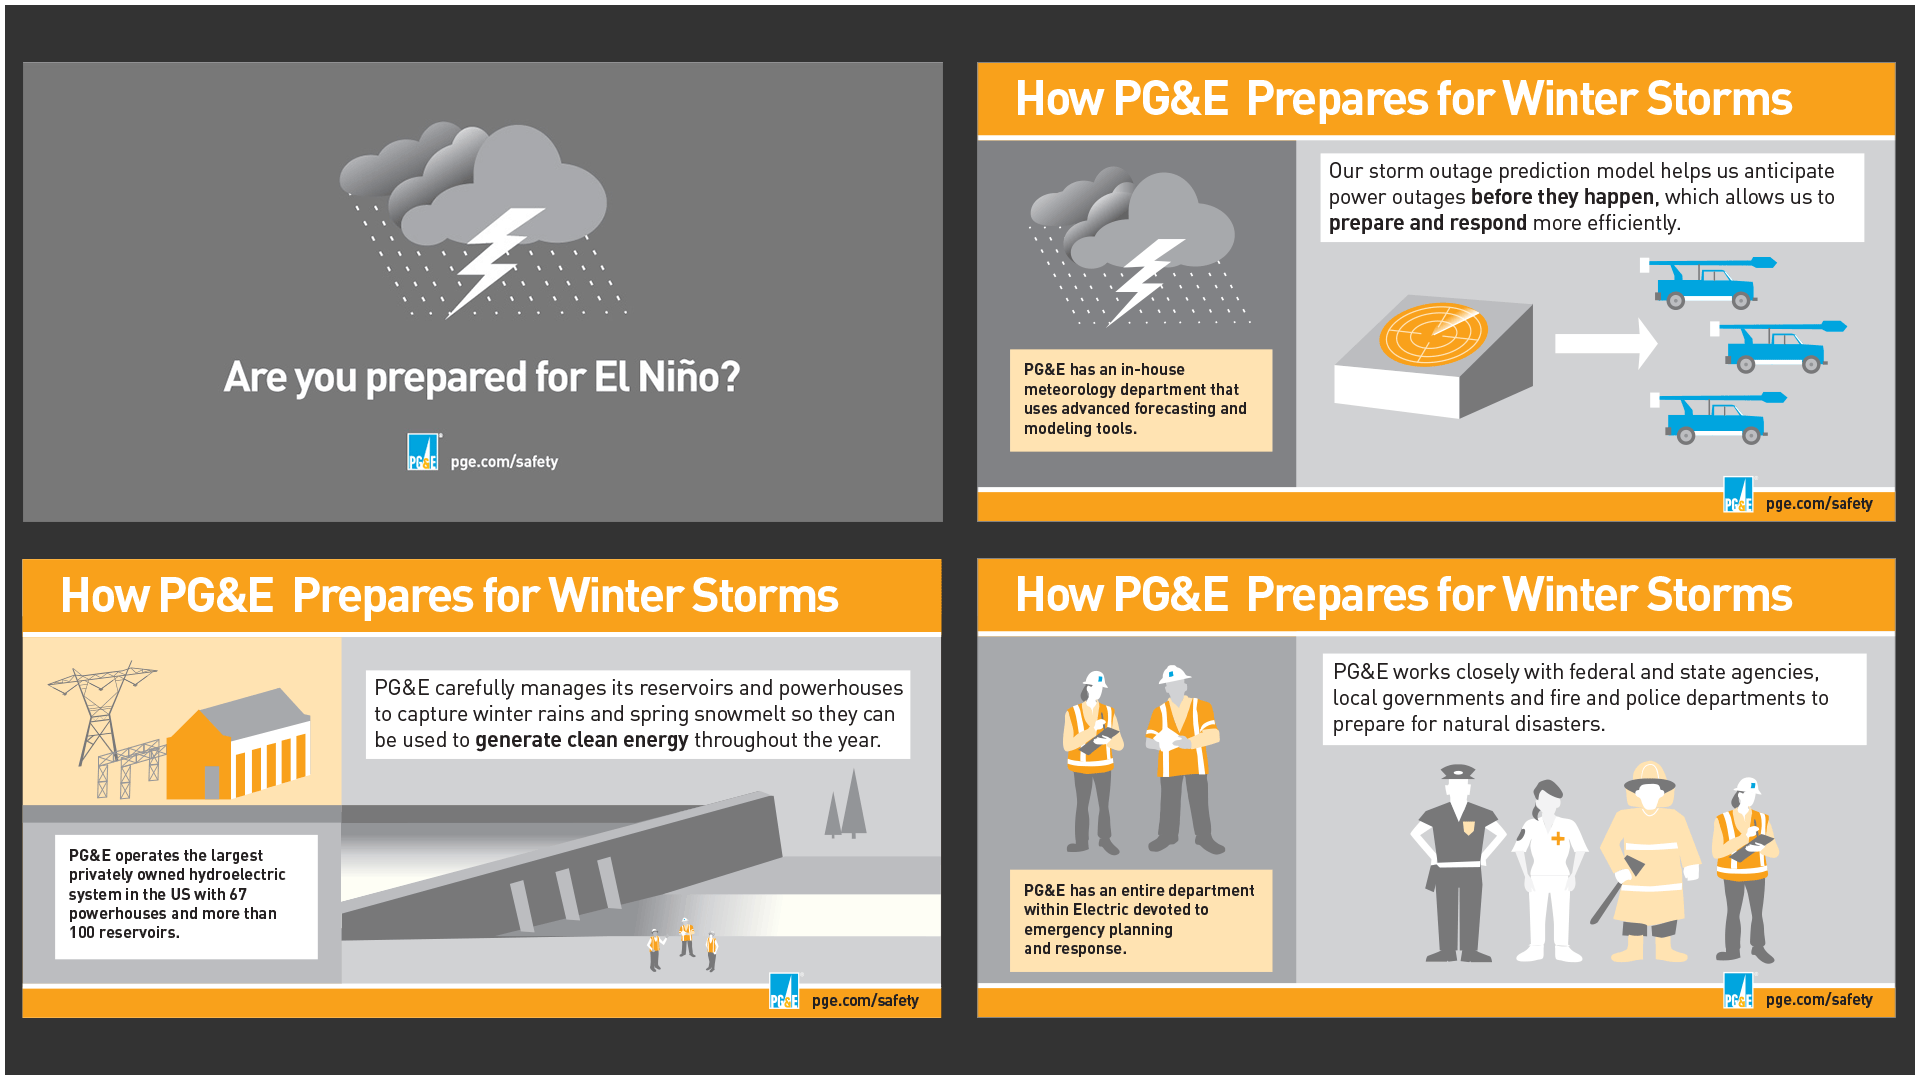 How PG&E Prepares for Winter Storms. (Media campaign.)